
Profitability ratios help evaluate a company’s ability to generate earnings and manage financial obligations, making them key in credit risk analysis. These ratios reveal how efficiently a business turns revenue into profit and whether it can handle debts and expenses. Here’s a quick overview:
- Gross Profit Margin: Measures how much revenue remains after covering production costs. Higher margins indicate better efficiency and lower financial risk.
- Operating Profit Margin: Accounts for operating expenses, showing how well a company manages its fixed costs and debt obligations.
- Net Profit Margin: Reflects overall financial health by calculating profit after all expenses.
- Return on Assets (ROA): Assesses how effectively a company uses its assets to generate income.
- Return on Equity (ROE): Indicates how well a company uses shareholder investments to produce profits.
These metrics are most useful when tracked over time and compared to industry standards. They also play a role in customizing trade credit insurance policies, helping businesses and insurers assess financial stability and creditworthiness.
Profitability Ratios for Credit Risk Analysis: Formulas and Benchmarks
Gross Profit Margin: Measuring Core Operations
Formula and Calculation
Gross profit margin is a key metric for understanding how much revenue remains after accounting for the cost of goods sold (COGS). The formula to calculate it is:
(Revenue – COGS) / Revenue × 100
This measurement highlights how effectively a company manages direct costs like labor and materials during production.
Take this example: A company with $500,000 in revenue and $300,000 in COGS (broken down as $200,000 for materials, $80,000 for direct labor, and $20,000 for production overhead) achieves a gross profit of $200,000. This translates to a 40% gross profit margin. In practical terms, 40% of every dollar earned is available to cover operating expenses, debt, and profits.
To put this in perspective, Microsoft Corp. reported $198.27 billion in total revenue and a gross margin of $135.6 billion for fiscal year 2022. This results in a gross profit margin of approximately 68%. Essentially, for every dollar Microsoft earned, about $0.32 went toward COGS, leaving $0.68 for other expenses.
These calculations do more than showcase operational efficiency – they also provide insight into potential financial risks, including credit vulnerabilities.
How Gross Profit Margin Indicates Credit Risk
Gross profit margin isn’t just a measure of efficiency; it’s also a crucial indicator of credit risk. A shrinking margin can signal rising production costs, which may strain a company’s financial health.
A declining gross profit margin is often a warning sign. As highlighted by Investopedia:
"When analyzing corporate profit margins, look for downward trends in the gross margin rate over time. This is a telltale sign the company may have future problems with its bottom line."
Such downward trends might reflect increasing material or labor costs, which can weaken a company’s ability to maintain competitive pricing. This makes the business more financially vulnerable. For example, a company operating with a slim 1% margin could quickly face losses if production costs rise by just 2%.
Industry benchmarks matter too. Margins vary significantly across sectors. For instance, regional banks often report gross margins near 99.75%, while the auto and truck manufacturing industry averages around 11.11% [8, 14]. Comparing a company’s margin to its industry peers and tracking its performance over 3–5 years provides a clearer picture of operational efficiency and potential risks.
Understanding these nuances can help identify whether a company is on stable financial footing or heading toward trouble.
sbb-itb-2d170b0
Operating Profit Margin: Measuring Profitability After Operating Costs
Formula and Calculation
Operating profit margin takes the analysis of profitability a step further than gross margin by factoring in all operating expenses. The formula is straightforward:
(Operating Income / Net Sales Revenue) × 100
Operating income, also known as EBIT (Earnings Before Interest and Taxes), is calculated by subtracting operating expenses – such as SG&A (Selling, General, and Administrative expenses), R&D (Research and Development), and depreciation – from gross profit.
Let’s look at an example: In fiscal year 2019, Apple Inc. reported $260.17 billion in revenue and $63.93 billion in operating profit. This translates into an operating profit margin of 24.6%, meaning Apple retained about $0.246 in operating profit for every dollar of revenue.
Industry benchmarks provide additional context for operating margins. For instance, supermarkets typically have very slim margins, while industries like advertising average around 12%, and utilities hover near 17%. These benchmarks help businesses understand where they stand relative to their peers.
Beyond evaluating efficiency, this metric also plays a critical role in assessing credit risk.
Credit Risk Implications
Operating profit margin is a key indicator of a company’s ability to manage its fixed costs and meet debt obligations. A healthy margin suggests the company generates enough profit to cover interest payments and stay financially stable.
"A company’s operating profit margin is usually seen as a superior indicator of the strength of a company’s management team, as compared to gross or net profit margin." – Corporate Finance Institute
This metric is particularly insightful because management has direct control over operating expenses like salaries, rent, and equipment leases – unlike raw material costs, which are often dictated by market conditions. A strong operating margin acts as a buffer during economic downturns, helping companies absorb cost increases and maintain competitive pricing.
On the flip side, significant fluctuations in operating margins can signal instability or business risks. Declining margins may point to poor growth strategies, inefficient use of capital, or vulnerability to economic headwinds. For example, from 2004 to 2011, Southwest Airlines consistently maintained operating margins at or above industry medians, while AMR Corporation (American Airlines’ parent company) struggled, reflecting challenges in controlling operating costs.
Using Operating Profit Margin in Accounts Receivable Insurance
Operating profit margin doesn’t just measure financial health – it also plays a crucial role in customizing Accounts Receivable Insurance. This metric helps insurers identify customers with the financial stability to meet payment obligations.
Generally, companies with higher operating margins are better equipped to handle market volatility, cost increases, or revenue drops. For example, a business operating at a 2% margin presents a much higher risk of default than one with a margin of 15% or 20%. Insurers analyze these margins alongside other profitability ratios to tailor policy pricing and coverage limits for both domestic and international trade relationships.
This analysis is particularly important in industries with high operating costs, like airlines, where expenses like fuel and labor consume a significant share of revenues. Even small shifts in operating margins in such sectors can indicate financial distress, making this metric an essential tool for managing risk.
Net Profit Margin: Measuring Overall Financial Health
Formula and Calculation
The net profit margin reveals how much profit a company retains after covering all its expenses. The formula is straightforward:
(Net Income / Total Revenue) × 100
Let’s break it down with a real-world example. For the three months ending September 30, 2024, Microsoft Corporation reported total net sales of $65.6 billion and a net income of $24.7 billion. Plugging in these numbers, Microsoft’s net profit margin comes out to 37.7%. This means Microsoft keeps about 38 cents from every dollar of revenue it earns.
Different industries operate within distinct margin ranges. For instance:
- Tech and software companies often hit margins between 15% and 25%.
- Retail businesses usually see margins between 2% and 6%.
- Restaurants typically operate within 3% to 9%.
A quick rule of thumb: a 10% margin is considered average, 20% is strong, and anything below 5% could signal potential financial trouble.
Understanding these benchmarks is crucial when assessing how net profit margins influence credit risk.
Credit Risk Insights
Net profit margin is more than just a profitability metric – it’s a key indicator of a company’s financial stability and its ability to handle debt. A higher margin acts as a cushion during economic downturns, while a lower margin leaves little room for error.
For example, a business with a 5% margin faces significant risk if sales drop, as there’s minimal flexibility to absorb losses. On the other hand, a company operating with a 20% margin is better equipped to weather revenue declines while still meeting its financial obligations.
Historical data underscores this: companies with margins consistently below 5% are more likely to encounter financial distress.
For underwriters in Accounts Receivable Insurance, tracking net margin trends is essential. A steady decline in margins can signal rising credit risks. By staying vigilant, insurers can fine-tune coverage limits and pricing to better reflect the likelihood of payment defaults, especially when evaluating trade relationships – both within the U.S. and internationally.
Return on Assets (ROA): Measuring Asset Efficiency
Formula and Calculation
Return on Assets (ROA) evaluates how well a company uses its resources – like buildings, equipment, inventory, and cash – to generate profit. The formula is straightforward:
(Net Income / Total Assets) × 100
Let’s break it down with a real-world example. As of January 31, 2025, Dillard’s Inc. reported $593 million in net income from $3.5 billion in total assets. This translates to an ROA of 16.8%.
Now compare that to Macy’s, which earned $582 million on $16.4 billion in assets, resulting in an ROA of 3.5%. Meanwhile, Kohl’s achieved $109 million in net income from $13.6 billion in assets, giving it a much lower ROA of 0.8%. These figures highlight how ROA can vary significantly between companies, even within the same industry.
As a rule of thumb, an ROA above 5% is generally considered strong, while anything over 20% is exceptional. However, industry norms play a big role here. Asset-heavy sectors like utilities and airlines often report ROAs below 5%, while asset-light businesses, such as software companies, frequently post figures above 20%.
Understanding these metrics helps investors and creditors evaluate how effectively a company manages its resources to generate profit.
Implications for Credit Risk
ROA doesn’t just measure efficiency – it’s also a key indicator of creditworthiness. It shows whether a company’s assets generate enough returns to justify the risks of lending or investing. Joe Knight from the Business Literacy Institute puts it this way:
[ROA] is a good indication of whether the company is even capable of generating a return that is worth whatever risk the investment may entail.
A declining ROA can be a red flag, suggesting that a company might be overinvested in assets that aren’t pulling their weight in revenue. For businesses managing trade credit relationships, keeping an eye on ROA trends – alongside industry benchmarks and historical data – offers valuable insight into how well management is utilizing resources. Companies with consistently strong ROA figures are better positioned to service debt and meet trade credit obligations.
When it comes to Accounts Receivable Insurance, these efficiency metrics are critical. They guide decisions on coverage limits and pricing, ensuring they align with a company’s financial strength and ability to meet obligations in both domestic and international markets.
Return on Equity (ROE): Measuring Shareholder Returns
Formula and Calculation
Return on Equity (ROE) tells us how effectively a company turns shareholder investments into profits. It’s a handy way to gauge management’s ability to generate returns using equity financing.
Here’s the formula:
(Net Income / Shareholders’ Equity) × 100
To get a more accurate picture, it’s best to use average shareholders’ equity. This means taking the equity figure at the beginning and end of the year, adding them together, and dividing by two.
For example, Intel Corporation in 2021 reported a net income of $19,868 million. Its shareholders’ equity started at $81,038 million and ended at $95,391 million. Using an average equity of $88,214.5 million, Intel’s ROE came out to 22.5%. This approach smooths out any fluctuations, offering a clearer picture of the company’s performance.
Generally, ROE between 15% and 20% is considered solid, while anything under 10% might raise concerns. However, different industries have different benchmarks. For instance, utility companies often see lower ROEs (around 10% or less) due to their high asset and debt levels, while technology firms often boast ROEs of 18% or higher. As of February 12, 2025, Apple’s 12-month average ROE hit an impressive 146.59%.
Understanding this calculation is essential for evaluating how ROE impacts credit risk.
Credit Risk Considerations
A high ROE isn’t always a good thing – it can sometimes hide risks. Companies with excessive debt can show inflated ROE figures because borrowing reduces the equity base (the denominator in the formula), pushing the ratio higher without necessarily improving operational efficiency. When ROE is much higher than Return on Assets (ROA), it’s often a sign that the company is leaning heavily on borrowed funds rather than strong business operations.
"If the ROA is low or the company carries significant debt, a high ROE can give investors a false impression about the company’s fortunes." – Investopedia
For a company with no debt, ROE and ROA will be identical.
Take Amazon.com as an example: In 2008, its ROE dropped from 58.5% in 2007 to 33.3%. This wasn’t due to poor profitability but rather because the company issued 7.8 million new shares, increasing its equity base. At the same time, it took on significant debt, which had previously inflated its ROE. Analysts determined that leverage, rather than operational efficiency, played a major role in the earlier high ROE.
Tracking ROE trends is also useful when tailoring Accounts Receivable Insurance. Stable ROE figures that align with industry norms often point to efficient capital management and lower risk of default. These insights can help adjust coverage limits and pricing for trade credit policies, whether for domestic or international markets.
Profitability Ratios: Formulas and Examples
How to Use Profitability Ratios in Credit Risk Analysis
Profitability metrics become even more powerful when paired with other credit risk tools. Take the Altman Z-Score, for instance – it already integrates profitability through its "C" variable (EBIT/Total Assets) and cumulative profitability via its "B" variable (Retained Earnings/Total Assets). This tool has shown an accuracy rate of 82% to 94% in predicting bankruptcy. By combining a declining Z-Score with profitability ratios, you can pinpoint whether inefficiencies in operations or rising external costs are causing financial strain.
The Z-Score estimates bankruptcy risk, while margin ratios allow for industry-specific comparisons. For example, leading up to the 2007 financial crisis, the median Altman Z-Score for companies was 1.81, meaning half of the firms were in financial distress. Bear Stearns, for instance, had a Z-Score of 0.29 in July 2007, which plummeted to -0.79 a year before its acquisition by JP Morgan Chase. Similarly, Lehman Brothers had a Z-Score of 0.06 in September 2008 at the time of its collapse, staying below 0.10 for two years before its bankruptcy.
"A low SMB Z-Score is best seen as an actionable early warning, giving you time to correct course before issues become structural." – Patrick Whatman, GetDefacto
To maximize insights, track profitability trends over time. A stable or improving Z-Score is often more reassuring than a high score that’s quickly deteriorating. If the "C" variable (EBIT/Total Assets) is dragging the score down, consider improving the operating profit margin by reducing costs or adjusting pricing strategies. Context is key – compare gross profit margins to industry averages, as the Z-Score’s "Sales/Total Assets" variable can differ widely across sectors like retail and manufacturing. Since the Z-Score relies on historical accounting data, it’s wise to supplement it with cash flow margin analysis for a clearer picture of short-term liquidity.
By integrating these trends into credit score models, businesses can fine-tune trade credit insurance policies with greater precision.
Using Ratios for Trade Credit Insurance
Profitability ratios are also valuable for customizing Accounts Receivable Insurance policies. For example, companies in the "Safe Zone" (Z-Score above 2.99) can qualify for higher credit limits, while those in the "Grey Zone" (1.8–2.99) require a closer look at their margins before coverage is approved. If a potential buyer’s net profit margin is shrinking but their operating margin remains solid, the issue might be temporary – such as a one-time loss – rather than a systemic problem.
Trend analysis is particularly useful for identifying when a company is slipping toward the "Distress Zone" (Z-Score below 1.8) before default becomes a real threat. In trade credit insurance, these tools help set credit limits and policy pricing for both domestic and international markets. Accounts Receivable Insurance offers tailored solutions, combining profitability insights with risk assessments and claims management to protect businesses from non-payment, bankruptcy, and even political risks.
Profitability Ratios Calculation Table
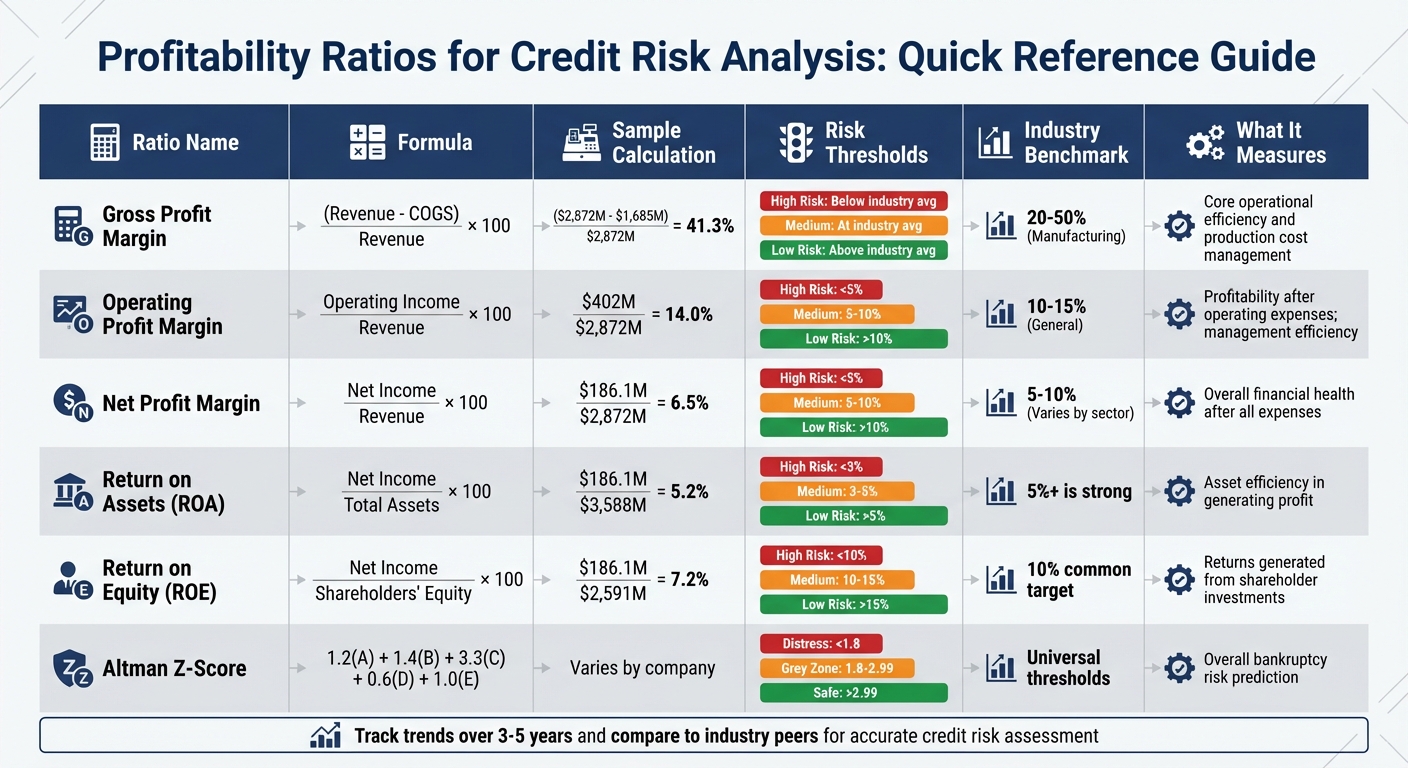
Here’s a quick reference table summarizing key profitability ratios, their formulas, sample calculations, and thresholds for interpretation.
| Ratio Name | Formula | Sample Calculation (US$ values) | Interpretation Thresholds | Industry Benchmark Range |
|---|---|---|---|---|
| Gross Profit Margin | (Revenue – COGS) / Revenue × 100 | ($2,872M – $1,685M) / $2,872M = 41.3% | High Risk: Below industry average; Medium Risk: At industry average; Low Risk: Above industry average | 20–50% (Manufacturing) |
| Operating Profit Margin | Operating Income / Revenue × 100 | $402M / $2,872M = 14.0% | High Risk: Below 5%; Medium Risk: 5–10%; Low Risk: Above 10% | 10–15% (General average) |
| Net Profit Margin | Net Income / Revenue × 100 | $186.1M / $2,872M = 6.5% | High Risk: Below 5%; Medium Risk: 5–10%; Low Risk: Above 10% | 5–10% (Varies by sector) |
| Return on Assets (ROA) | Net Income / Total Assets × 100 | $186.1M / $3,588M = 5.2% | High Risk: Below 3%; Medium Risk: 3–5%; Low Risk: Above 5% | 5% or higher is generally good |
| Return on Equity (ROE) | Net Income / Shareholders’ Equity × 100 | $186.1M / $2,591M = 7.2% | High Risk: Below 10%; Medium Risk: 10–15%; Low Risk: Above 15% | 10% is a common target |
| Altman Z-Score | 1.2(A) + 1.4(B) + 3.3(C) + 0.6(D) + 1.0(E) | Varies by company | High Risk (Distress): <1.8; Medium Risk (Grey): 1.8–2.99; Low Risk (Safe): >2.99 | N/A (Universal threshold) |
Conclusion
Profitability ratios play a key role in evaluating credit risk by highlighting a company’s ability to generate earnings and handle financial challenges. As the CFI Team explains:
Higher margin and return ratios are an indication that a company has a greater ability to pay back debts.
These ratios also allow for consistent comparisons across industries.
The true value of profitability analysis lies in observing trends over time and comparing performance to industry standards. Among these metrics, operating margin stands out because it is harder for management to manipulate, offering a more dependable view of core profitability than net profit. However, it’s important to remember that acceptable margins vary by industry – regional banks often report gross margins near 99.75%, whereas the automotive sector averages closer to 9.04%.
When paired with tools like the Altman Z-Score, profitability ratios provide a sharper lens for assessing credit risk. For instance, companies with a Z-score above 2.6 – commonly seen as a safe zone – and strong profitability ratios may be eligible for higher credit limits. On the other hand, those with lower scores might require more cautious evaluation.
FAQs
Which profit ratio best predicts default risk?
The Altman Z-Score stands out as the most effective profit ratio for predicting default risk. This metric blends multiple financial ratios into a single formula to assess the probability of bankruptcy. Thanks to its well-rounded methodology, it has become a go-to tool for credit risk analysis.
How many years of margin trends should I review?
When evaluating a business’s financial health, it’s essential to review margin trends over the past 3 to 5 years. This analysis provides a clearer picture of how stable and consistent the company’s profitability has been. By identifying patterns or fluctuations in these margins, you can gauge the reliability of their earnings. This insight is especially critical when assessing credit risk, as steady margins often indicate a more dependable financial foundation.
How can ROE be high but still risky?
A high Return on Equity (ROE) might seem appealing at first glance, but it can spell trouble if it’s largely fueled by excessive debt. Leverage can amplify profits, sure, but it also cranks up financial risk – especially if the company finds itself struggling to keep up with debt payments. To get a clear picture of the risk involved, it’s crucial to evaluate how well the company balances profitability with its level of debt.