When assessing a company’s credit risk, cash flow statements are your go-to tool. Why? Because they reveal the actual movement of cash – not just profits on paper. A company might show high net income but still fail to pay its bills if its cash flow is weak. Here’s what you need to know:
- Operating Cash Flow (OCF): The most critical section. It shows if the business can generate enough cash from its core operations to cover expenses. Persistent negative OCF is a red flag.
- Investing Cash Flow: Tracks spending on assets. Negative cash flow here often means growth investments, while positive cash flow could signal asset sales – good if strategic, bad if it’s a desperate move.
- Financing Cash Flow: Highlights reliance on borrowing or equity. Positive numbers might mean new loans or stock sales, while negative numbers could indicate debt repayment or dividends.
Key warning signs include:
- Negative OCF paired with growing net income (suggests accounting issues or poor collections).
- Heavy reliance on borrowing to fund operations.
- Selling key assets just to stay afloat.
To gauge risk, use ratios like:
- Operating Cash Flow Ratio: OCF ÷ Current Liabilities (above 1.0 is healthy).
- Cash Flow Coverage: OCF ÷ Total Debt Service (aim for 1.5 or higher).
- Cash Flow Margin: OCF ÷ Revenue (higher percentages indicate efficient cash generation).
For added protection, consider Accounts Receivable Insurance (ARI). It safeguards cash flow by covering unpaid invoices, helping businesses maintain liquidity even during customer defaults.
Bottom Line: Cash flow analysis is essential for spotting financial trouble early. Focus on where cash comes from, how it’s used, and whether the company relies too much on external funding. Pair this with forecasting and stress testing to get a full picture of credit risk.
How cash flow-first underwriting is redefining small business lending
sbb-itb-2d170b0
Understanding the 3 Parts of a Cash Flow Statement
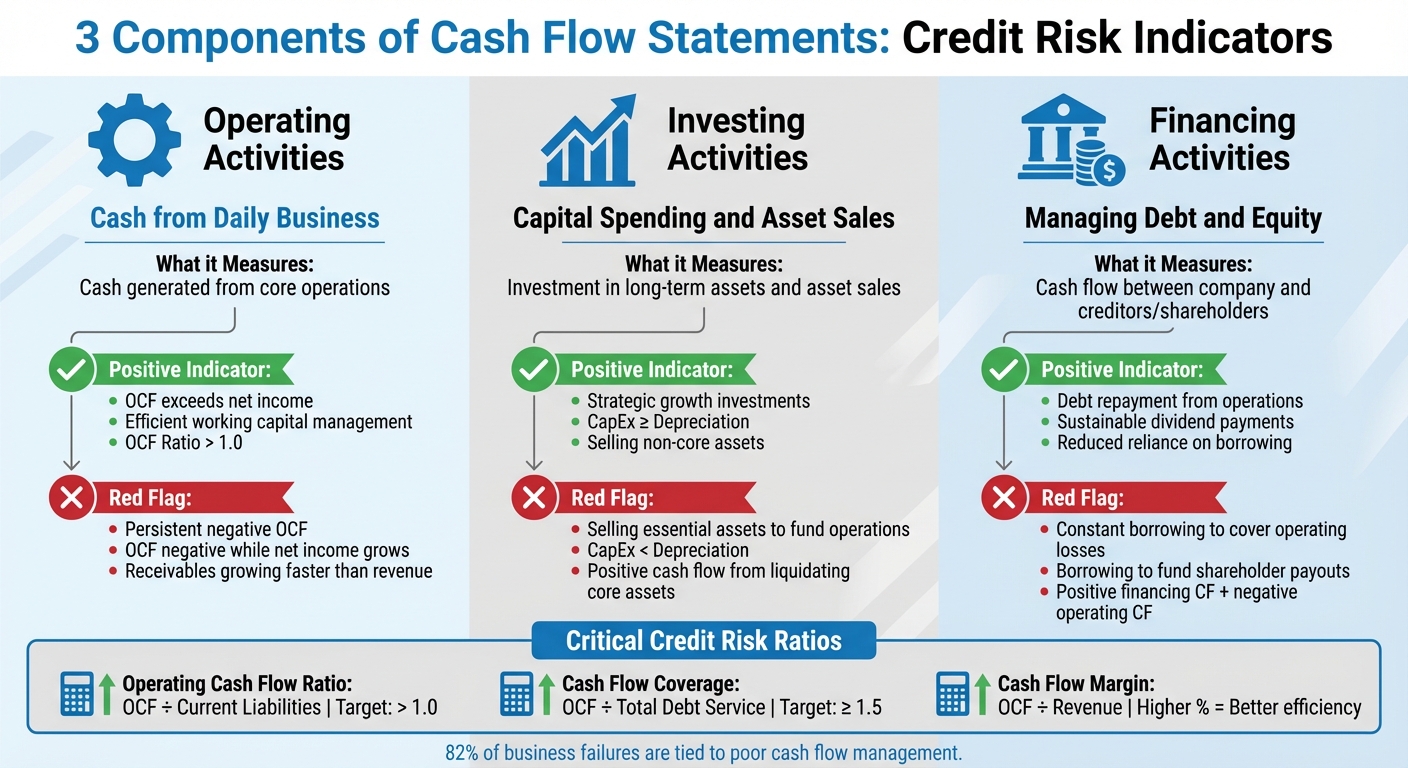
Cash Flow Statement Components and Credit Risk Warning Signs
A cash flow statement breaks down cash movements into three key categories: operating activities, investing activities, and financing activities. Each section provides insights into different areas of a company’s financial health – whether it’s daily operations, growth investments, or financial strategies. Let’s explore how these components help identify potential credit risks.
Operating Activities: Cash from Daily Business
This section focuses on cash generated by the company’s core operations. It answers a critical question: does the business produce enough cash to sustain itself, without relying on loans or selling assets? For credit risk assessment, this is the most revealing area, as it reflects earnings quality. When operating cash flow consistently surpasses net income, it indicates efficient working capital management and lower liquidity risk.
Investing Activities: Capital Spending and Asset Sales
The investing section typically shows negative cash flow when a company invests in property, equipment, or other long-term assets. This often signals growth. On the other hand, positive cash flow in this section usually stems from asset sales, which warrants closer scrutiny.
"Positive investing cash flow: Often means asset sales – healthy when exiting non-core units, worrying if you’re selling the family silver to fund operations." – Upflow
To gauge sustainability, compare capital expenditures (CapEx) to depreciation. If CapEx aligns with or exceeds depreciation, it suggests the asset base is being maintained. However, if CapEx falls short, it could indicate future operational risks. Additionally, calculating free cash flow – by subtracting CapEx from operating cash flow – reveals how much cash remains after covering essential investments.
Financing Activities: Managing Debt and Equity
This section tracks cash flow between the company and its creditors or shareholders. It highlights whether the company relies on external funding or manages its finances independently. Positive cash flow here often means the company is borrowing money or issuing stock, while negative cash flow indicates debt repayment, stock buybacks, or dividend distributions.
A key consideration is whether the company depends on external financing to cover operational shortfalls. Persistent positive financing cash flow paired with negative operating cash flow suggests deeper financial challenges. If access to capital markets tightens, such companies could face significant difficulties.
| Activity Type | Measures | Positive Indicator | Red Flag |
|---|---|---|---|
| Operating | Cash from daily business | OCF exceeds net income | Persistent negative OCF |
| Investing | Capital spending and asset sales | Strategic growth investments | Selling essential assets to fund operations |
| Financing | Debt and equity management | Debt repayment from operations | Constant borrowing to cover operating losses |
Key Ratios for Measuring Credit Risk
Once you’ve broken down the components of the cash flow statement, the next logical step is to assess risk using specific financial ratios. These ratios take cash flow data and turn it into clear indicators of a company’s financial health.
Liquidity Ratios: Gauging Short-Term Financial Health
Liquidity ratios help answer a critical question: can the company handle its financial obligations over the next 12 months? One key metric here is the Operating Cash Flow Ratio, which compares operating cash flow to current liabilities. This ratio shows whether the business generates enough cash from daily operations to cover short-term debts. A value above 1.0 indicates strong coverage, while anything below signals potential liquidity issues.
Another useful metric is the Cash Flow Margin, which measures efficiency by dividing operating cash flow by total revenue. This tells you how much of each dollar in revenue is converted into cash. For example, in January 2026, TalentCloud HR – a SaaS company – reported a 21% cash flow margin, turning $4.5 million in revenue into $950,000 of operating cash flow. Other ratios like the Current Ratio (ideally between 1.2 and 2.0) and the Quick Ratio (around 1.0) provide additional insights into a company’s liquidity buffer.
While these ratios focus on short-term financial stability, coverage ratios take a deeper look at the company’s ability to manage its debt obligations.
Coverage Ratios: Managing Debt Responsibly
Coverage ratios go beyond short-term liquidity to evaluate whether a company can handle its overall debt load. The Cash Flow Coverage Ratio, for instance, divides operating cash flow by total debt service (including both interest and principal payments). Unlike the interest coverage ratio, which only assesses the ability to pay interest, this metric provides a full picture of whether the company can cover its entire debt load.
"Cash coverage ratios carry more weight than paper profits when credit committees sign off on a loan." – Alexandre Antoine, Upflow
A ratio above 1.5 reflects strong financial health, with flexibility for growth or building reserves. Ratios between 1.0 and 1.5 indicate obligations are being met but with limited room for error. Anything below 1.0 is a warning sign that the company cannot meet its debt obligations through operational cash. For example, Tesla Inc. experienced a dramatic shift in its Cash Flow Coverage Ratio between 2017 and 2020 – rising from 0.15 in 2017 (indicating heavy reliance on external financing) to 1.25 in 2020, showing improved ability to cover debt through operations.
The Interest Coverage Ratio (calculated as EBIT divided by interest expense) adds another layer of insight into default risk. Ratios below 2x suggest potential trouble, while those above 4x are typical for firms with strong credit ratings. Lenders often include minimum coverage requirements as part of loan agreements, and falling within 10% of these thresholds can quickly raise red flags.
Warning Signs in Cash Flow Statements
After analyzing critical financial ratios, the next step is to identify patterns in cash flow statements that could indicate deeper financial problems. These warning signs go beyond the numbers, offering insights that might otherwise be overlooked.
Persistent Negative Operating Cash Flow
A company that consistently reports negative operating cash flow is likely struggling to sustain its core operations. This suggests the business is relying on external funding rather than genuine demand in the market. A particularly concerning sign is when net income appears to grow while operating cash flow remains stagnant. This mismatch could point to issues like questionable revenue recognition practices or challenges in collecting receivables.
Another red flag is inefficiency in managing working capital. For instance, if receivables grow faster than revenue or inventory levels rise disproportionately, it could signal collection problems or poor asset management. Similarly, when revenue increases but operating cash flow remains negative, it often highlights flawed unit economics – where the costs of acquiring and serving customers outweigh the cash generated from sales. For lenders, these patterns can undermine confidence in the company’s ability to meet its financial obligations.
Operational cash flow issues are often compounded by an overdependence on external funding, which adds further risk.
Heavy Dependence on Borrowing or Stock Sales
When a company relies heavily on borrowing or issuing stock to maintain cash flow, it raises serious concerns. Frequent debt or equity issuance can mask operational weaknesses, signaling that the business depends on external capital rather than generating sufficient cash internally. This reliance becomes especially risky during periods of tightened capital markets, such as during the 2008 financial crisis, when access to funds can dry up.
Excessive borrowing not only increases leverage but also creates immediate pressure due to debt repayment obligations. Short-term debt is particularly risky, as it must be repaid or refinanced quickly, putting significant strain on liquidity. Moreover, companies that borrow to fund shareholder payouts despite insufficient free cash flow exhibit an unsustainable strategy. These practices erode lender trust and significantly elevate credit risk.
Selling Assets to Generate Cash
A positive cash flow in the investing activities section often points to asset sales. While selling non-core assets can be a strategic move, using core operating assets to fund daily operations is a major warning sign.
"Positive investing cash flow: Often means asset sales – healthy when exiting non-core units, worrying if you’re selling the family silver to fund operations." – Upflow
When asset sales coincide with negative operating cash flow, it could indicate that the company is liquidating assets merely to stay afloat. Additionally, if capital expenditures (CapEx) are not keeping pace with depreciation, it suggests the company might be shrinking its productive capacity, which could hinder future revenue generation. Repeated asset sales may also signal that the company has maxed out its credit lines or is unable to secure traditional financing. For creditors, this pattern is a red flag for severe financial distress and a heightened risk of default.
Projecting Future Cash Flows and Testing Scenarios
After analyzing historical cash flow patterns, the next step is to project future cash flows. This helps assess whether a business can navigate upcoming challenges or if it’s at risk of a liquidity crunch. Cash flow forecasting and scenario testing are key tools for this process.
Building Cash Flow Forecasts
Cash flow forecasts estimate liquidity over specific timeframes – ranging from weeks to years. Two common methods are used:
- Direct Method: Focuses on future inflows and outflows based on expected transactions.
- Indirect Method: Begins with net income and adjusts for non-cash items (like depreciation), making it ideal for precise short-term planning or long-term financial strategies.
When building forecasts, it’s crucial to align assumptions about receivables and payables with historical payment patterns. Don’t overlook timing quirks like months with three payroll cycles, quarterly tax payments, or annual insurance premiums.
Forecasts are typically divided into three timeframes:
- Short-term: 1–13 weeks
- Medium-term: 3–6 months
- Long-term: 12+ months
A rolling forecast – adding a new month as each one ends – ensures you maintain a continuous, forward-looking view of your financial health. To stay realistic, estimate revenue conservatively and expenses on the higher side. This prevents overcommitting based on overly optimistic expectations.
Interestingly, about 49% of finance professionals worry that their cash flow data lacks reliability. If actual cash flow consistently deviates by more than 5% from projections, it’s a sign to revisit your assumptions and refine your forecasting model.
Once a baseline forecast is set, the next step is to test its resilience under challenging conditions.
Testing Financial Resilience Under Adverse Conditions
With a forecast in place, stress testing can help you understand how your business might perform in tough situations. This involves creating scenarios like a Base Case (normal operations), Best Case (growth or improvement), and Worst Case (stress test) to evaluate possible outcomes.
Here’s how different analyses can help:
- Sensitivity Analysis: Adjusts one variable at a time – such as a 2% rise in interest rates or a 10% increase in supplier costs – to measure the impact on liquidity.
- Scenario Analysis: Alters multiple variables simultaneously to model complex events, like a recession where sales fall 15%, receivables extend by 30 days, and costs rise 10%.
- Reverse Stress Testing: Starts with a failure point (e.g., insolvency) and works backward to identify the conditions that could lead to it.
"Stress testing, a simulation technique used to evaluate how different stress conditions will affect a company’s cash flow, is essential for preparing for adverse financial scenarios." – FasterCapital
A critical focus is the timing factor – the delay between paying expenses and collecting revenue. Even profitable businesses can face liquidity issues if timing gaps aren’t managed. To stay prepared, establish action triggers like a 15% increase in Days Sales Outstanding (DSO) or cash buffer days falling below 30. These triggers enable swift, objective decisions during a crisis.
Experts recommend maintaining a cash reserve to cover 3 to 6 months of operating expenses. This buffer provides protection against sudden financial shocks.
Take TalentCloud HR as an example. In January 2026, this SaaS company conducted a cash flow analysis showing a 21% operating margin and $950,000 in operating cash. Despite reinvesting $750,000 into AI features and $120,000 for patents, they maintained a positive free cash flow of $280,000. After a $3M Series B funding round, they paid down $500,000 in debt and boosted liquidity by 46% to $8M, enabling expansion into the EMEA market. This demonstrates how scenario planning and stress testing can guide strategic decisions, even during heavy investment periods.
Combining Numbers with Business Context
When evaluating credit risk, it’s not enough to rely solely on cash flow metrics. Numbers tell part of the story, but understanding the reasons behind those figures is equally critical. Many business failures occur because the context behind the numbers is overlooked. To get a complete picture, financial data should be paired with insights like management strategies, market conditions, and other non-financial factors.
Take, for example, the distinction between a strategic move and a fundamental problem. Negative operating cash flow might signal a deliberate investment in growth – such as spending on research and development or expanding into new markets. On the other hand, it could point to a deeper issue, like a flawed business model that struggles to generate sustainable income. Similarly, positive investing cash flow might reflect healthy divestment of non-core assets, but it becomes a red flag if it means selling critical equipment just to stay afloat.
| Factor | Healthy Context | Warning Sign Context |
|---|---|---|
| Negative Operating Cash Flow | Investing in market share or R&D initiatives | Core business model is unsustainable |
| Positive Investing Cash Flow | Selling non-core assets strategically | Selling essential equipment to cover expenses |
| Positive Financing Cash Flow | Raising funds for expansion | Borrowing to offset ongoing losses |
| High Accounts Receivable | Rapid growth in a new market | Poor collection processes or aggressive revenue recognition |
These internal metrics take on even more significance when viewed alongside external influences. For example, cash flow issues can arise from factors outside management’s control, like losing a key customer, supply chain disruptions, or changes in regulations. A company’s cash flow margin – calculated as Operating Cash Flow divided by Revenue – can act as a benchmark. A 20% margin often indicates a self-sustaining business, though what’s considered healthy varies by industry and stage of growth. Startups, for instance, often experience negative cash flow in their early years, while mature companies are expected to maintain consistent positive cash flow.
It’s also essential to align management’s stated goals with actual cash flow behavior. If a company regularly spends more on dividends and share buybacks than its free cash flow allows, it may be borrowing to satisfy shareholders – a practice that’s hard to sustain. Research from U.S. Bank highlights that 82% of business failures are tied to poor cash flow management or a lack of understanding of cash positions. By integrating numerical data with qualitative insights, lenders can form a more accurate and informed view of credit risk, leading to better decision-making.
Accounts Receivable Insurance: Protecting Against Credit Risk
No matter how thorough your cash flow analysis is, it can’t always shield you from customer defaults. This is where Accounts Receivable Insurance (ARI) steps in, turning uncollected revenue into secured cash. ARI helps manage credit risks by transforming potential losses into insured exposures, providing a safeguard for your business.
The link between ARI and cash flow is straightforward. High accounts receivable balances or a widening gap between net income and operating cash flow often signal "paper profits" – revenue recorded but not yet collected. ARI ensures that even if a customer defaults, those receivables are converted into actual cash. Consider this: 77% of CFOs report their teams frequently struggle with processing and collecting invoices.
This type of insurance doesn’t just offer coverage – it provides a strategic advantage. ARI providers deliver customized policies tailored to your industry and customer base. They also conduct risk assessments on both new and existing customers, empowering you to make smarter decisions about credit terms. Additionally, they take care of claims management, easing the burden on your internal teams when defaults happen. For companies navigating unfamiliar markets or dealing with customer concentration risks, ARI becomes a critical layer of protection.
From a financial perspective, ARI acts as a safety net, particularly when it comes to maintaining liquidity. By guaranteeing cash inflows from insured invoices, ARI supports essential liquidity ratios like the Debt Service Coverage Ratio. Without ARI, a major customer default could force emergency borrowing, leading to negative financing cash flow trends. Instead, an insurance payout ensures operational stability. This is especially important when you realize that 82% of business failures are tied to poor cash flow management or a lack of understanding of cash position.
Think of ARI as the perfect complement to your cash flow analysis. While your analysis pinpoints risky customers and payment patterns, ARI shields you from the fallout if those risks become reality. For businesses dealing with aging receivables or customers in volatile industries, this combination of insight and protection strengthens financial resilience.
Conclusion
Understanding cash flow statements is key to grasping the financial reality behind a company’s numbers. Operating Cash Flow (OCF) highlights whether a business’s core operations can sustain themselves, while Free Cash Flow (FCF) shows the cash available for crucial obligations like debt repayment. As the saying goes, "Revenue is vanity. Profit is theory. Cash is reality".
Effective credit evaluations go beyond the numbers, blending financial metrics with a deeper understanding of the business context. For instance, a startup pouring funds into growth paints a very different picture than a seasoned company doing the same. Similarly, positive cash flow from selling off core assets might signal trouble rather than stability. Take the example of one company that balanced strong cash flow generation with strategic investments – this reflected thoughtful financial management rather than short-term gains.
Both historical data and future projections are essential for a complete analysis. Historical trends reveal whether profits consistently translate into cash, while forecasts can uncover potential liquidity issues before they become critical.
"Historical cash flow tells you what happened, but forecasting tells you what’s coming. The sooner you can predict cash shortfalls, the more options you have to address them".
Keep an eye on red flags: ongoing negative operating cash flow, reliance on borrowing to fund operations, and a growing gap between net income and OCF. These warning signs are especially critical when you consider that 82% of small business failures stem from poor cash flow management. To mitigate risks, calculate coverage ratios, monitor the Cash Conversion Cycle, and run stress tests to evaluate a company’s resilience under pressure.
These steps form the foundation for strong, forward-thinking credit evaluations. The key is to look beyond surface-level figures. Scrutinize where cash originates, assess trends, and ensure the numbers align with the company’s strategy and stage of growth. By combining detailed analysis with safeguards like Accounts Receivable Insurance, you can build a solid defense against credit risk.
FAQs
How many periods of cash flow data should I review for credit risk?
To effectively assess credit risk, it’s a good idea to review three to four periods of cash flow statements. Looking at multiple periods allows you to spot trends, evaluate how stable the cash flow is, and pinpoint any potential weaknesses. This broader perspective gives a much clearer understanding of the company’s financial health over time.
What’s the best way to spot “paper profits” in operating cash flow?
To identify "paper profits" in operating cash flow, start by comparing net income with cash flow from operations. If there’s a significant gap between the two, it could signal that reported profits aren’t backed by real cash inflows. Additionally, evaluate whether operating cash flow consistently tracks with net income over an extended period. Red flags include poor cash conversion ratios or irregular cash flow patterns despite strong net income, which may suggest profits are being overstated.
How do I stress-test cash flow to see if debt payments stay covered?
To evaluate cash flow resilience, consider using scenario analysis to simulate challenging situations, such as a drop in revenue or a surge in costs. The goal is to see if your cash inflows can still meet debt obligations when faced with these pressures. This approach helps pinpoint potential weaknesses and ensures debt payments remain feasible even during tough times. Tools like scenario planning templates can be useful for systematically exploring different scenarios and understanding their impact on cash flow.